Dispersion of a tracer puff
 |
 |
 |
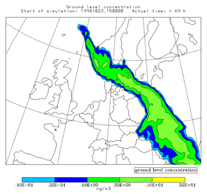 |
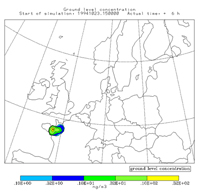
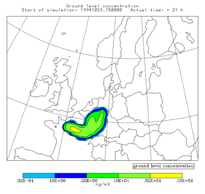
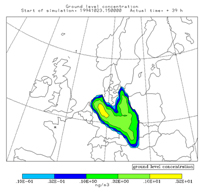
These figures depict the calculated temporal evolution of the
concentration in a tracer puff. The sequence is top-left, top-right, bottom-left, bottom
right, and the tracer concentration is shown at 6 h, 21 h, 39 h, and 69 h, respectively, after
the release.
(European Tracer Experiment, 1994)
| back | up | continue |